
How Are We Doing?
Calendar Year 2021
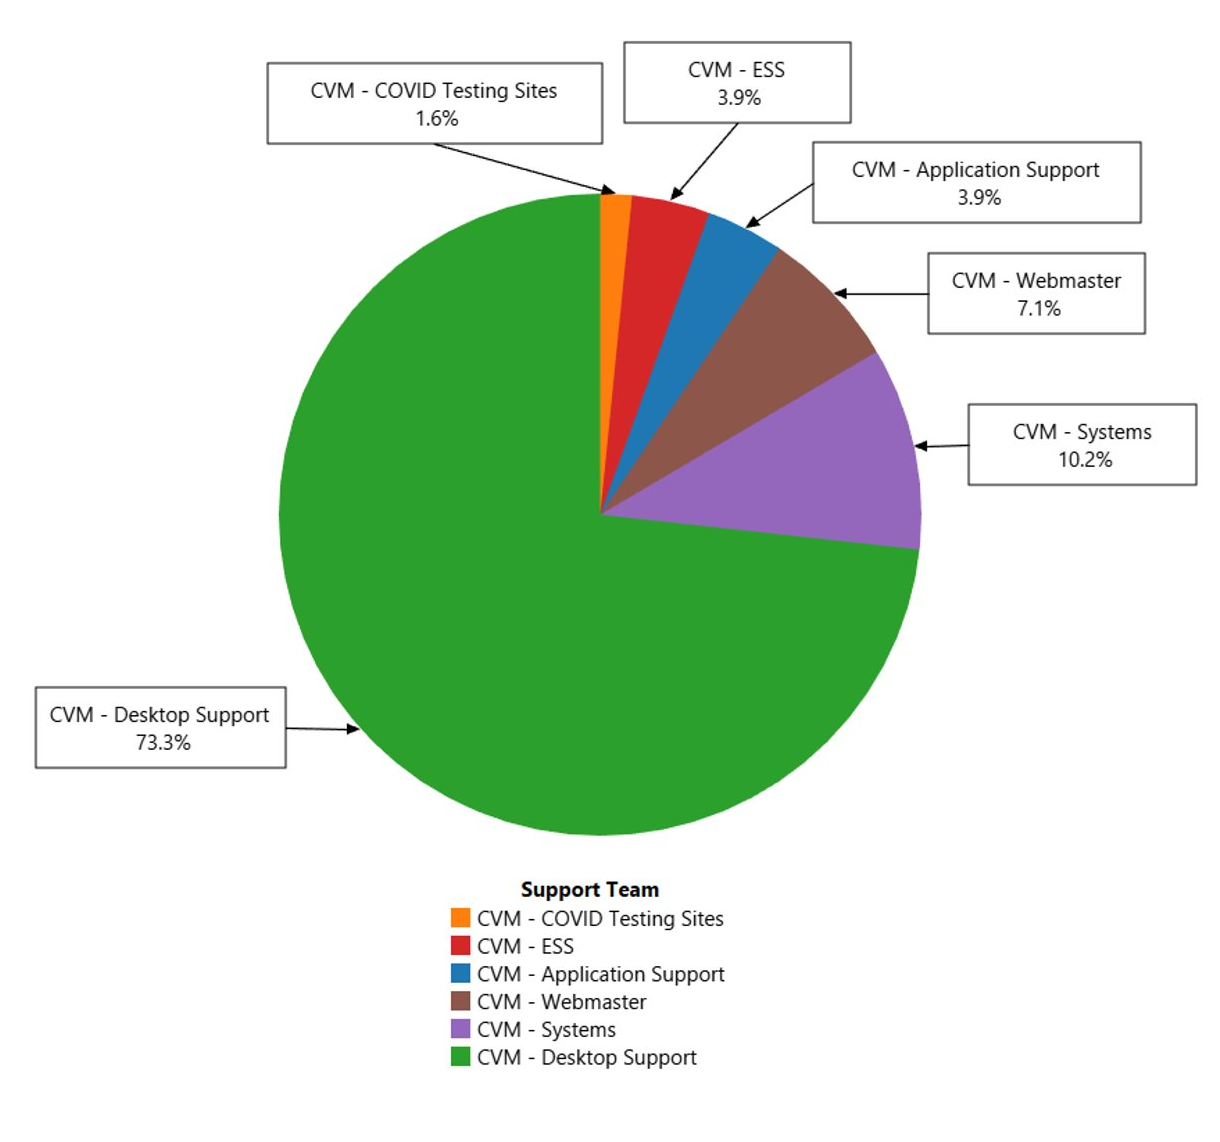
VMIT Support Tickets
|
Support Team |
Total Tickets |
Percent |
|---|---|---|
|
CVM - Desktop Support |
2,869 |
73.3% |
|
CVM - Systems |
400 |
10.2% |
|
CVM - Webmaster |
278 |
7.1% |
|
CVM - ESS |
154 |
3.9% |
|
CVM - Application Support |
153 |
3.9% |
|
CVM - COVID Testing Sites |
62 |
1.6% |
|
Totals |
3,916 |
100.0% |
*Total tickets submitted 1/1/2021 – 10/31/2021
NOTE: Does not include all operational support for
COVID Testing Sites
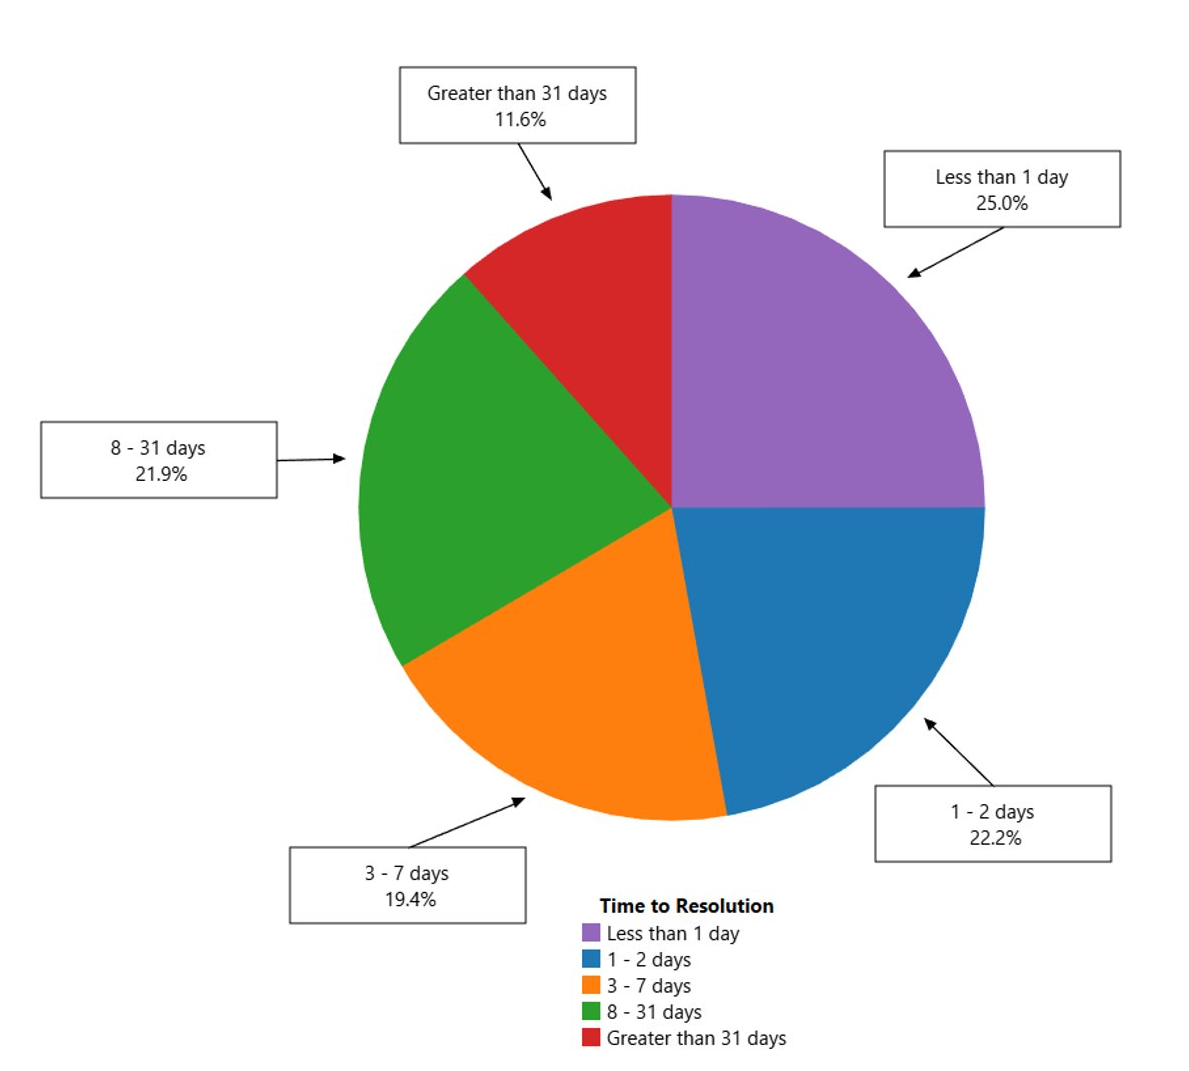
VMIT Tickets – Time to Resolution
|
Time to Resolution |
Total Tickets |
Percent |
|---|---|---|
|
0 days |
925 |
25.0% |
|
1 - 2 days |
821 |
22.2% |
|
3 - 7 days |
717 |
19.4% |
|
8 - 31 days |
811 |
21.9% |
|
Greater than 31 days |
428 |
11.6% |
|
Totals |
3,702 |
100.0% |
*Resolved tickets submitted 1/1/2021 – 10/31/2021
VMIT Tickets by Department
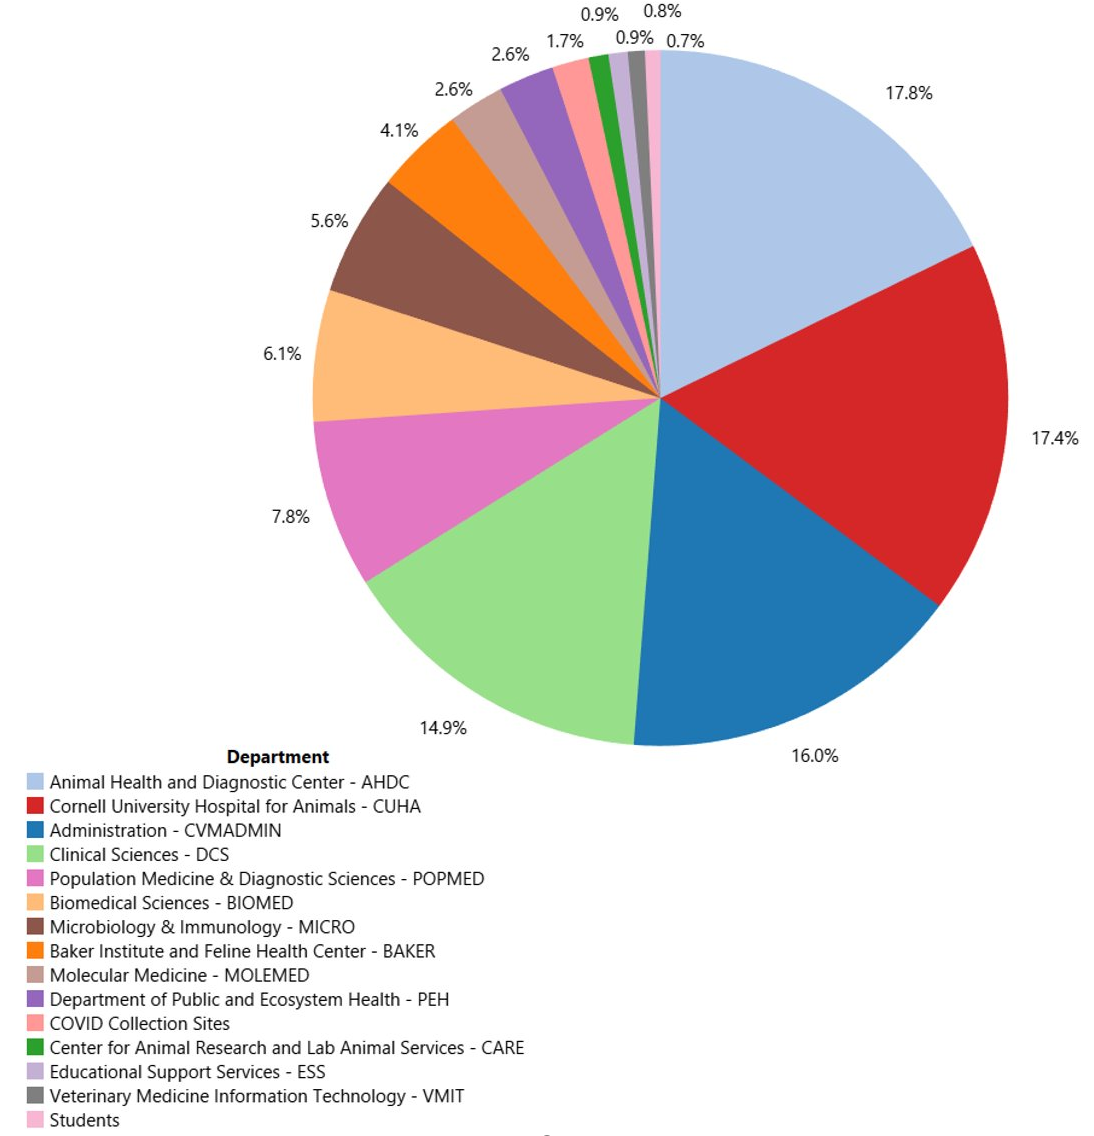
*Total tickets submitted 1/1/2021 – 10/31/2021
|
Department |
Tickets |
Percent |
|---|---|---|
|
Animal Health and Diagnostic Center - AHDC |
697 |
17.8% |
|
Cornell University Hospitals for Animals - CUHA |
681 |
17.4% |
|
Administration - CVMADMIN |
628 |
16.0% |
|
Clinical Sciences - DCS |
583 |
14.9% |
|
Population Medicine & Diagnostic Sciences - POPMED |
305 |
7.8% |
|
Biomedical Sciences - BIOMED |
240 |
6.1% |
|
Microbiology & Immunology - MICRO |
221 |
5.6% |
|
Baker Institute and Feline Health Center - BAKER |
161 |
4.1% |
|
Molecular Medicine - MOLEMED |
102 |
2.6% |
|
Department of Public and Ecosystem Health - PEH |
101 |
2.6% |
|
COVID Collection Sites |
67 |
1.7% |
|
Center for Animal Research and Lab Animal Services - CARE |
36 |
0.9% |
|
Educational Support Services - ESS |
35 |
0.9% |
|
Veterinary Medicine Information Technology - VMIT |
31 |
0.8% |
|
Students |
28 |
0.7% |
|
Totals |
3,916 |
100.0% |
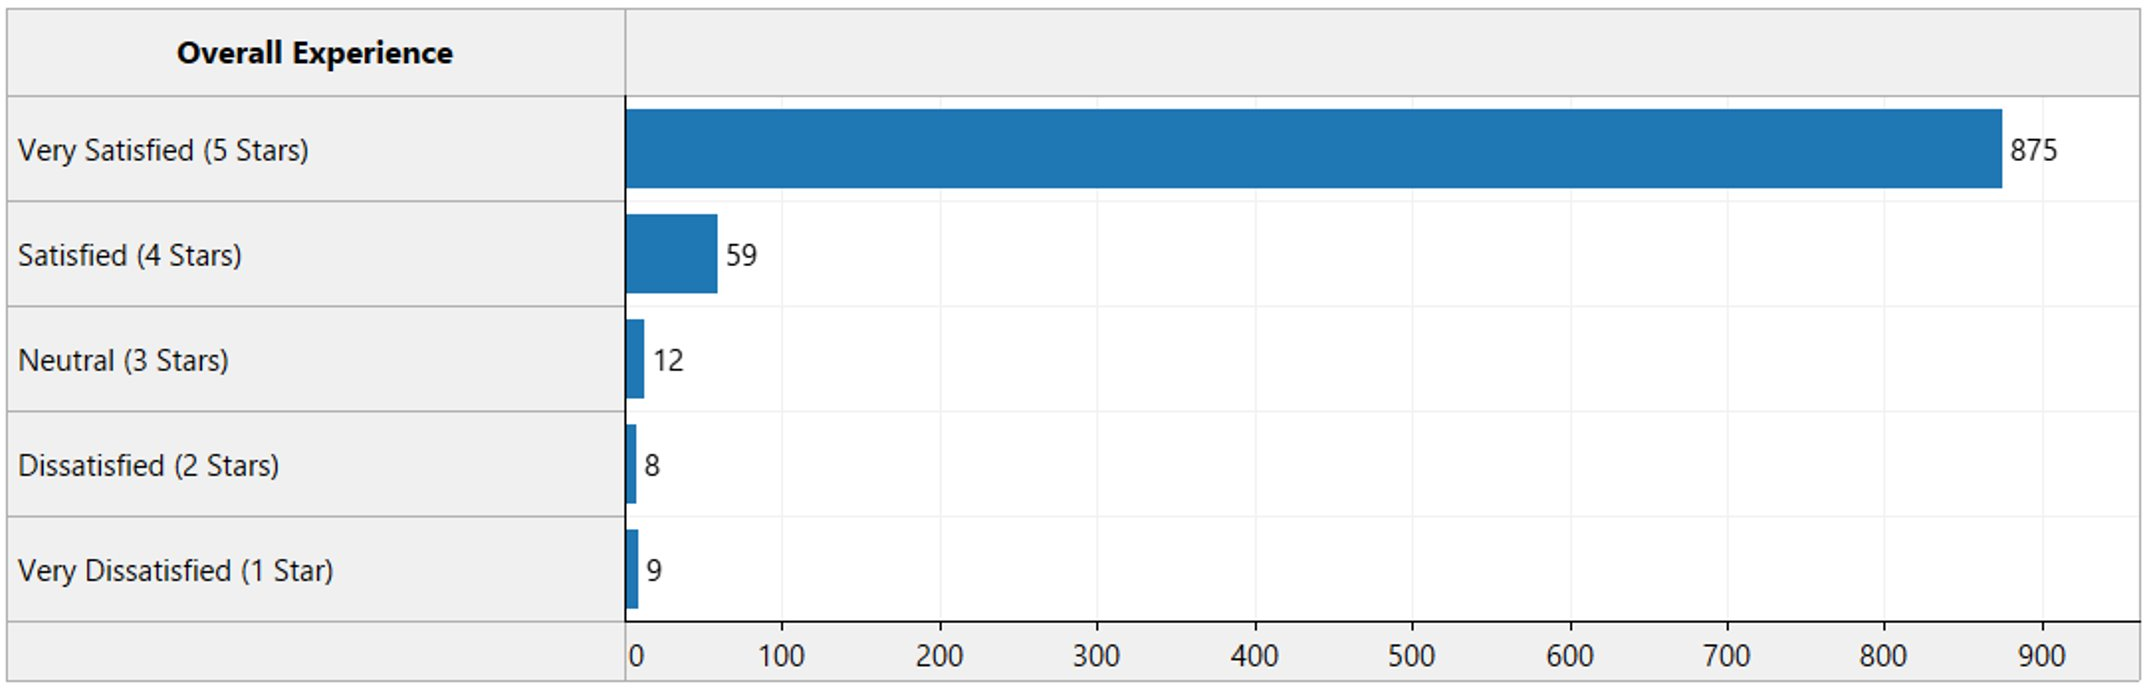
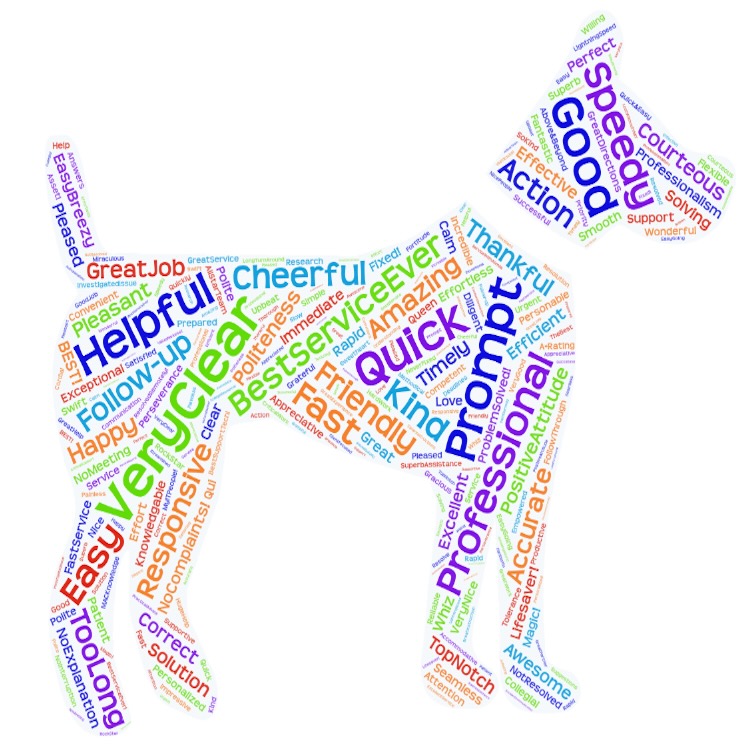
VMIT Customer Satisfaction Ratings
97% Satisfaction 25% Response Rate