

Annual Report 2024
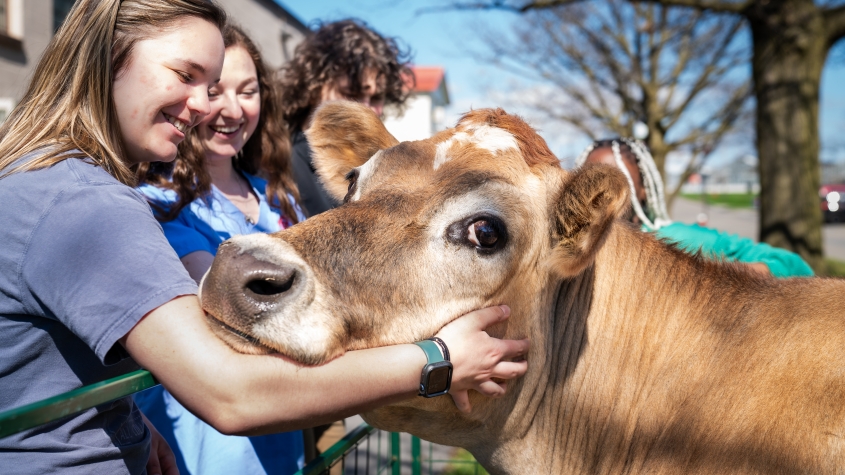
Education
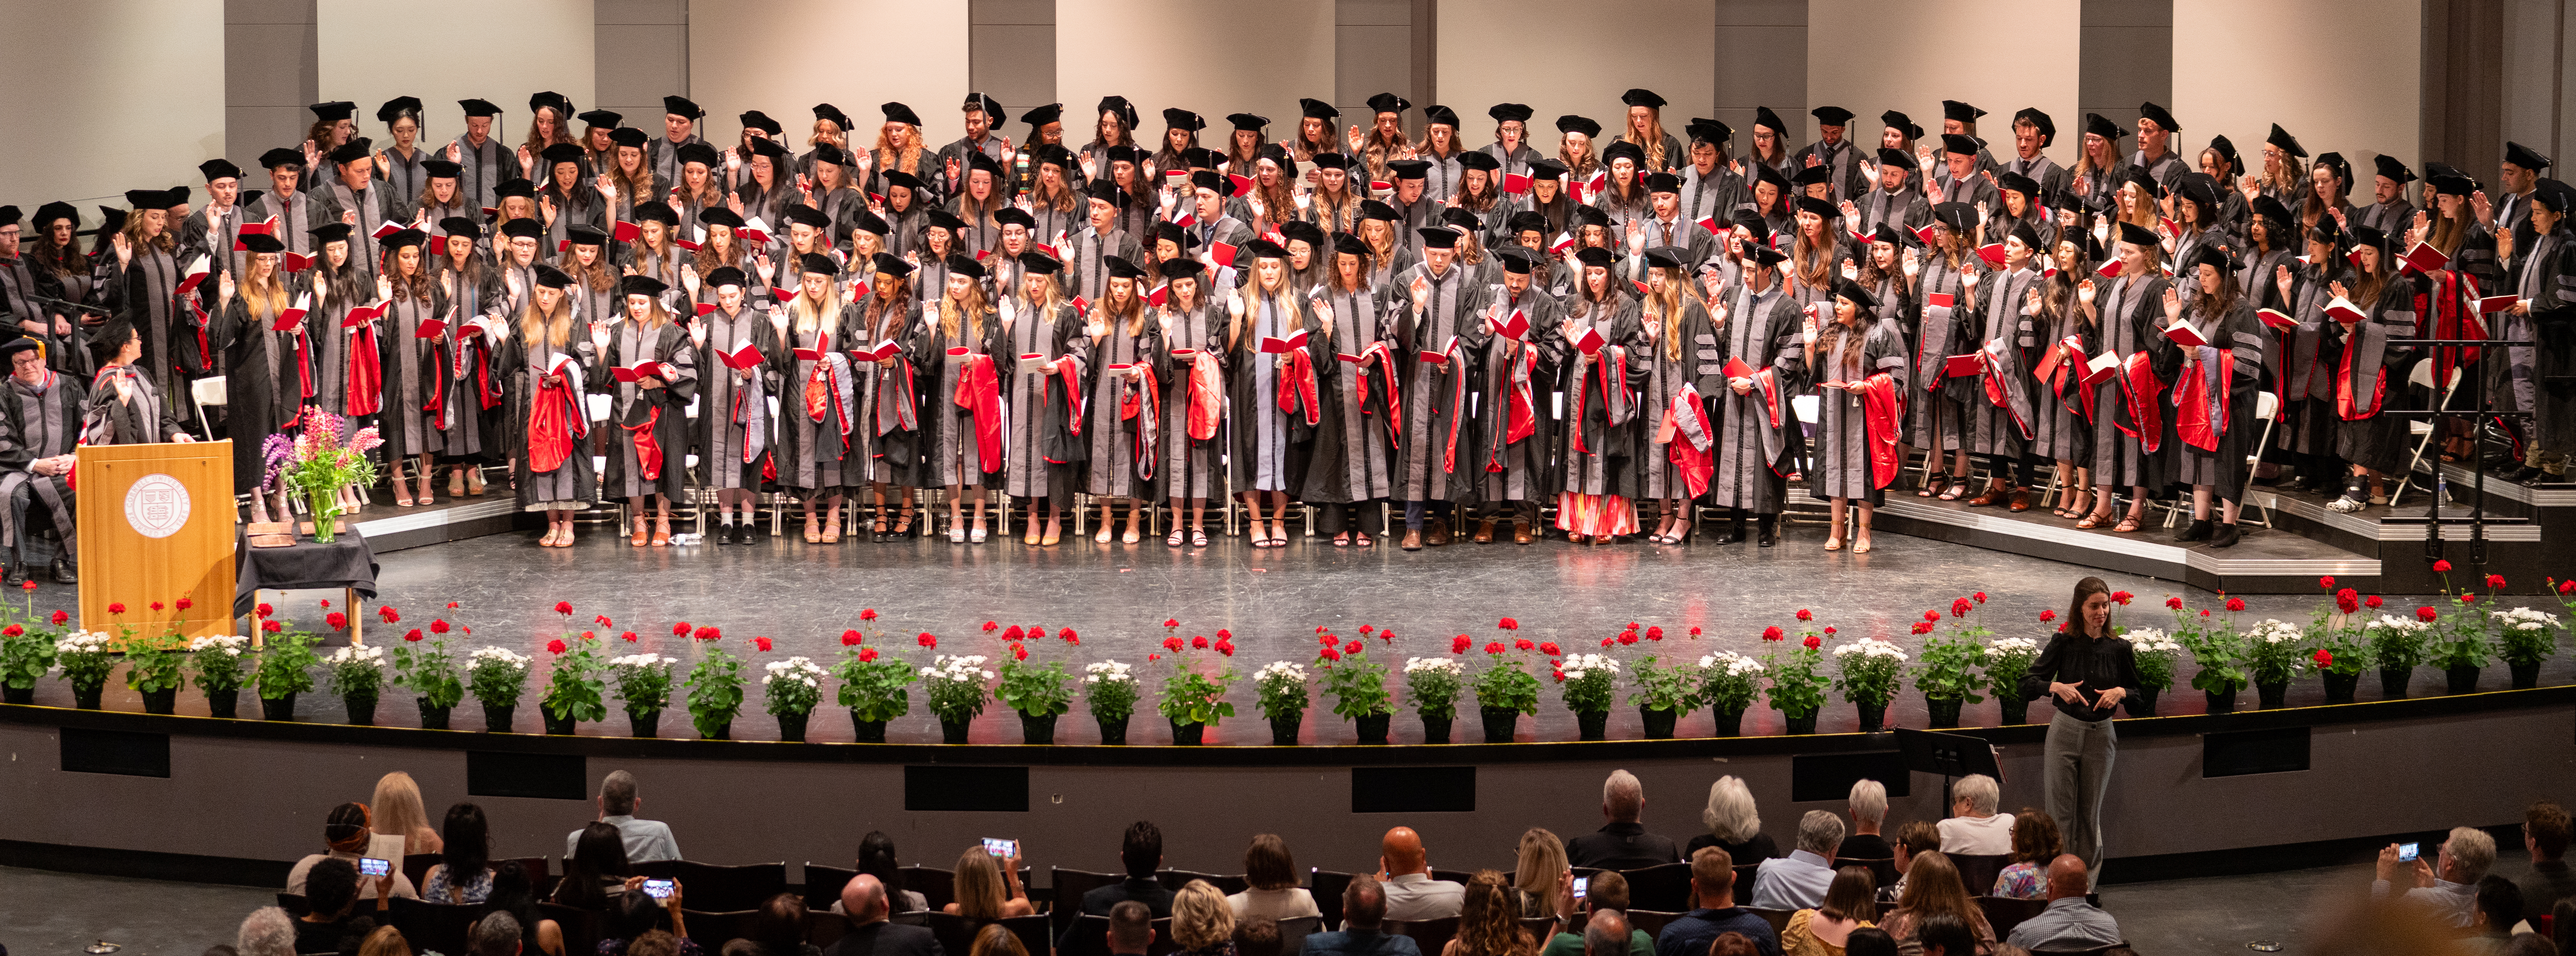
Student Demographics
| Incoming D.V.M. Class of 2028 demographics | Data |
|---|---|
| Class size | 126 |
| Women | 86% |
| N.Y.S. Residents | 48% |
| Under-Represented Minorities | 12% |
| First-Generation Students | 14% |
| Incoming Class demographics | Data |
|---|---|
| Class Size | 85 |
| Women | 62% |
| N.Y.S. Residents | 21% |
| Priority Population* | 64% |
| International | 54% |
| First Generation | 36% |
*The MPH Program defines priority populations as U.S. students representing underserved populations, as well as those who are underrepresented in the public health workforce and education.
| Incoming Class demographics | Data |
|---|---|
| Class size | 10 |
| Women | 90% |
| Under-Represented Minorities | 20% |
| International | 30% |
| Incoming Class demographics | Data |
|---|---|
| Class size | 10 |
| Women | 90% |
| Under-Represented Minorities | 20% |
| International | 30% |
Scholarship Distributions
| Year | Total scholarship funds ($M), all classes |
|---|---|
| FY 2024 | $4.2 |
| FY 2023 | $3.9 |
| FY 2022 | $3.7 |
| FY 2021 | $3.0 |
| FY 2020 | $2.6 |
| Year | Total Scholarships ($K), all classes |
|---|---|
| FY 2024 | $1,033 |
| FY 2023 | $490 |
| FY 2022 | $660 |
| FY 2021 | $627 |
| FY 2020 | $372 |
Research
Noteworthy New Awards
| Recipient | Award | Amount |
|---|---|---|
| Gen Meredith | USDA National Institute of Food and Agriculture: Seeding Health Education and Literacy for Health Equity (SHELHE) | $349,931 |
| Richard Cerione | NIH-National Institute of General Medical Sciences (NIGMS): Studies of Global Signal Transduction | $2,710,288 |
| Diego Diel | USDA Animal and Plant Health Inspection Service: Animal Health Diagnostic Center in New York as a Home for the NAHLN-NBAF Emerging Disease Investigator in Region 1 | $1,122,000 |
| Sarah Caddy | Bill and Melinda Gates Foundation: Evaluating Potential Correlates of Protection for Rotavirus Vaccination | $190,645 |
| Casey Cazer | USDA National Institute of Food and Agriculture: Revealing Antimicrobial Resistance Trends in the Food Chain with Machine Learning Tools | $300,000 |
| Melanie Ragin | USDA National Institute of Food and Agriculture: Pathways to Access Veterinary Education and Research | $247,500 |
Shawna Cook (Mentor: Jacquelyn Evans) | The Hartwell Foundation: Genetic Investigation of Radial Hemimelia in a Feline Disease Model | $100,000 |
| David Pisu | NIH-National Institute of Allergy and Infectious Diseases (NIAID): Elucidation of the Molecular Mechanism(s) for the Non-Responsiveness of CD38-AMs to Tuberculosis Infection | $408,200 |
| Anushka Dongre | Breast Cancer Coalition of Rochester (BCCR): The mechanistic Underpinnings of Epithelial-Mesenchymal Transition (EMT) and CD73-Mediated Immunosuppression in Breast Carcinomas | $50,000 |
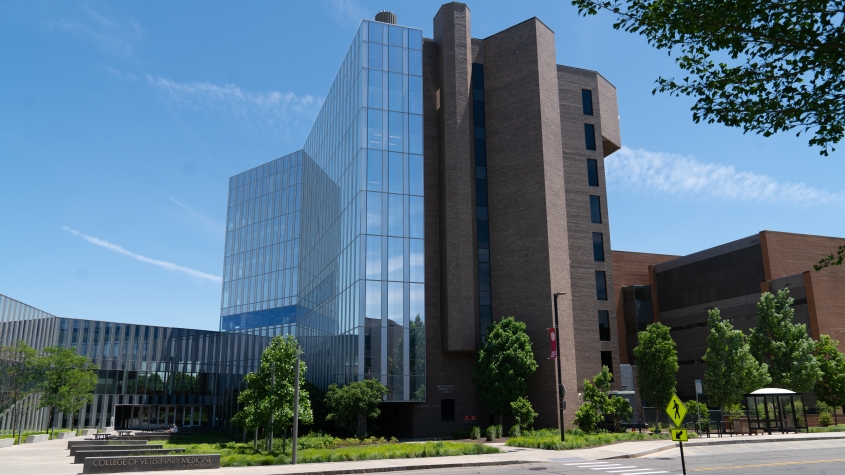
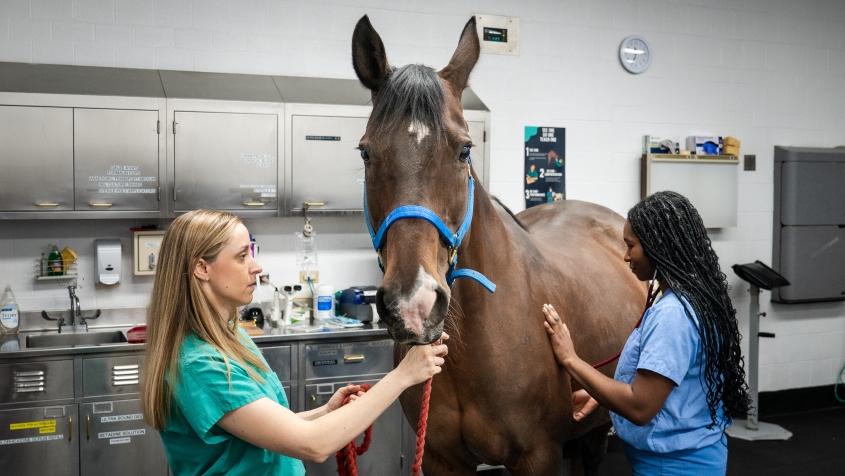
Clinical and Diagnostic Services
Cornell University Hospital for Animals
| Time | Jul | Aug | Sep | Oct | Nov | Dec | Jan | Feb | Mar | Apr | May | June | Total |
|---|---|---|---|---|---|---|---|---|---|---|---|---|---|
| FY 2024 | 3,285 | 3,550 | 3,167 | 3,348 | 3,147 | 2,779 | 3,041 | 2,929 | 3,152 | 3,400 | 3,653 | 3,544 | 38,995 |
| FY 2023 | 3,151 | 3,270 | 2,972 | 3,010 | 2,819 | 2,369 | 2,657 | 2,486 | 2,845 | 2,747 | 3,301 | 3,297 | 33,745 |
| FY 2022 | 3,180 | 3,138 | 2,896 | 2,932 | 2,827 | 2,336 | 2,474 | 2,377 | 2,835 | 2,753 | 2,952 | 3,045 | 30,083 |
| FY 2021 | 2,479 | 2,437 | 2,545 | 2,597 | 2,408 | 2,074 | 2,222 | 2,038 | 2,684 | 2,671 | 2,858 | 3,070 | 23,715 |
| FY 2020 | 2,325 | 2,519 | 2,316 | 2,394 | 2,066 | 1,736 | 2,153 | 1,904 | 1,424 | 999 | 1,666 | 2,213 | 26,594 |
Animal Health Diagnostic Center
| Year | Accessions (K) |
|---|---|
| FY 2024 | 306.5 |
| FY 2023 | 291.6 |
| FY 2022 | 282.7 |
| FY 2021 | 261.8 |
| FY 2020 | 224.0 |
Faculty & Staff
| Employee status | Number of individuals |
|---|---|
| Faculty | 249 |
| Other Academic Staff | 28 |
| Post-terminal Degree Trainees | 170 |
| Visiting, Courtesy & Adjunct Academics | 76 |
| Staff/Union | 666 |
| Total | 1,189 |
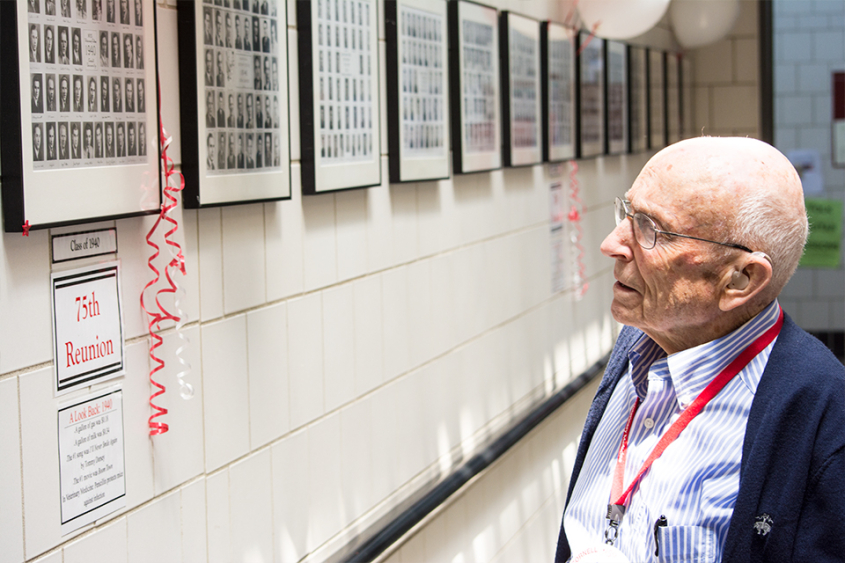
Alumni Affairs and Development
$55.6M in total new gifts and commitments
$39.4M raised in cash
$1.4M raised for the Annual Fund
| Donor Source | Percentage of donors |
|---|---|
| Friends | 58% |
| CVM Alumni | 18% |
| Non-CVM Alumni | 12% |
| Other | 8% |
| Corporations & Foundations | 4% |
| Year | Scholarship funds raised ($M) |
|---|---|
| FY 2024 | $4.6 |
| FY 2023 | $6.1 |
| FY 2022 | $7.6 |
| FY 2021 | $7.4 |
| FY 2020 | $2.1 |
Financials
Selected Revenues
| Category | Total ($M) |
|---|---|
| Tuition and Fees | $35.3 |
| Current Use Gifts | $16.4 |
| Investment Distributions | $14.4 |
| State Appropriations | $35.9 |
| AHDC Sales and Services | $27.5 |
| CUHA Sales and Services | $38.4 |
| Indirect Cost Recoveries | $11.8 |
| Sponsored Contracts and Grants | $38.2 |
| Total | $217.8 |
Selected Expenses
| Category | Total ($M) |
|---|---|
| Salaries and Wages, Faculty | $49.8 |
| Salaries and Wages, Staff | $60.9 |
| Capital Acquisitions | $4.7 |
| Financial Aid | $9.0 |
| Utilities | $5.6 |
| University Administrative Costs | $37.7 |
| Total | $167.5 |
Endowment Market Value FY 2024
| Category | Market Value ($M) | Percentage | Earnings ($M) |
|---|---|---|---|
| Program Support | $193 | 54% | $6.7 |
| Position Support | $67 | 19% | $2.4 |
| Student Aid | $94 | 27% | $3.2 |
| Total | $354 | 100% | $12.3 |