

Dean's Letter
This year, we've seen many new successes in our programs. The college has engaged in the successful recruitment of faculty and leadership members across many departments and centers, including naming the inaugural director of the Cornell Richard P. Riney Canine Health Center as Dr. Rory Todhunter, and hiring of numerous new faculty members. We also continue our curriculum renewal initiative to further strengthen the career readiness of students, and recently launched a new competency-based clinical rotation assessment, feedback, and coaching system.
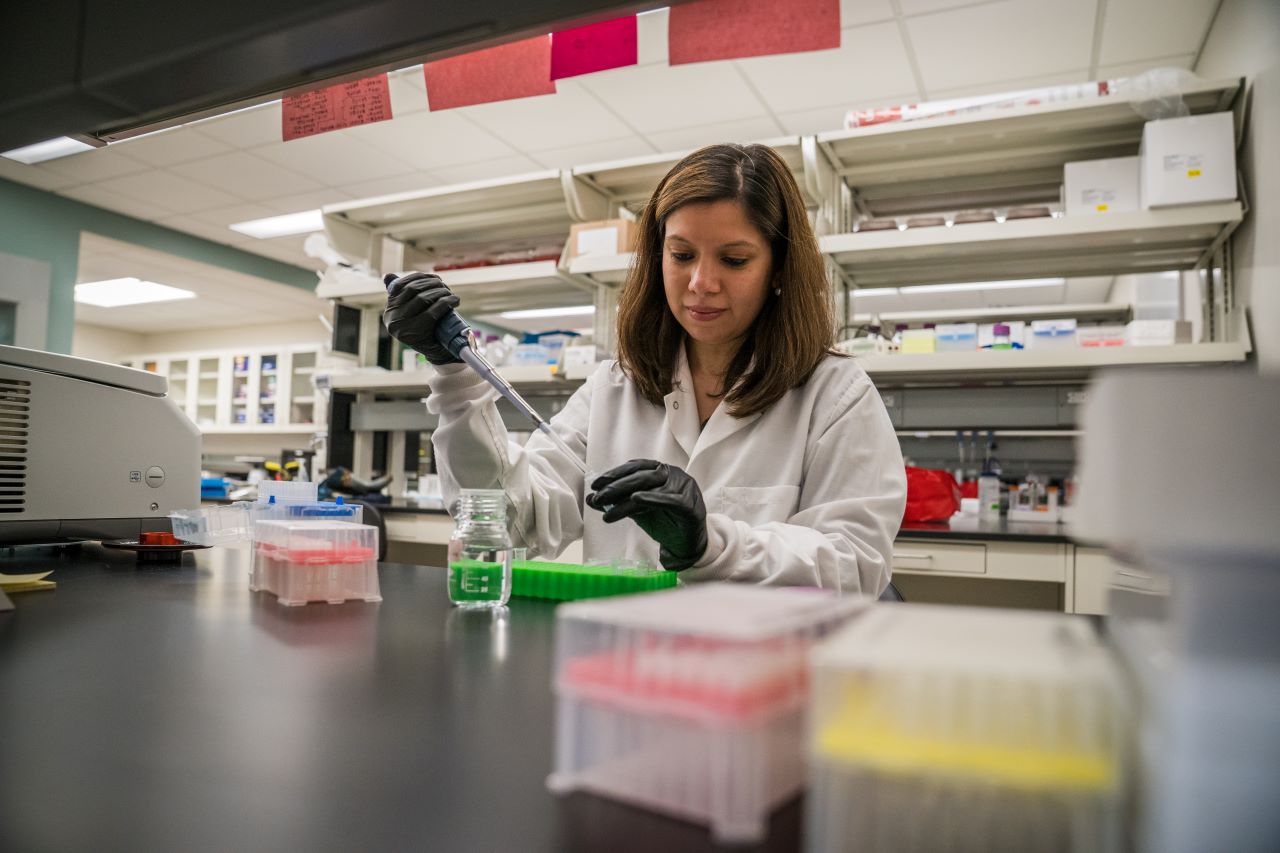
Our research programs continue to improve both animal and human health. Priority areas include infectious disease, genomics, cancer biology, reproductive biology, stem cell biology and regenerative medicine, dairy, sustainable food production and applied clinical research. In addition to strong, sustained growth in external funding, we have seen unprecedented growth in internal grant funding, with 35 proposals being funded in the last year.
Our hospital and diagnostic lab productivity has increased above pre-pandemic historical highs, while hospital facility upgrades and new technology platforms have improved workflow, service, learning and clinical research. The diagnostic lab led our response to the avian flu and developed whole genome sequencing for SARS-CoV-2 in wildlife and humans. Our new Equine Park facility is nearing completion and the design work for the Veterinary Research Tower renovation is underway.
As always, I hope you enjoy reviewing the past year’s achievements.
Sincerely,
Lorin D. Warnick, D.V.M., Ph.D. '94
Austin O. Hooey Dean of Veterinary Medicine
Education
Over the last year, the college graduated 119 Doctors of Veterinary Medicine (D.V.M.), 17 Biomedical and Biological Sciences Ph.D.s, and 48 Master of Public Health (M.P.H.) students.
Significant progress was made on a D.V.M. curriculum renewal initiative to further strengthen the career readiness of students, integrating professional competencies throughout the curriculum, and using competency-based assessment and feedback tools, launching a new competency-based clinical rotation assessment, feedback, and coaching system. In addition, faculty received enhanced educational resources and training in evidence-based teaching practices.
The Center for Veterinary Business and Entrepreneurship developed seven distribution courses for D.V.M. students and introduced a certificate in veterinary business and management. In the D.V.M. program, the clinical curriculum is being redesigned. In addition, a new assessment system and coaching for remediation program in clinical rotations was launched.
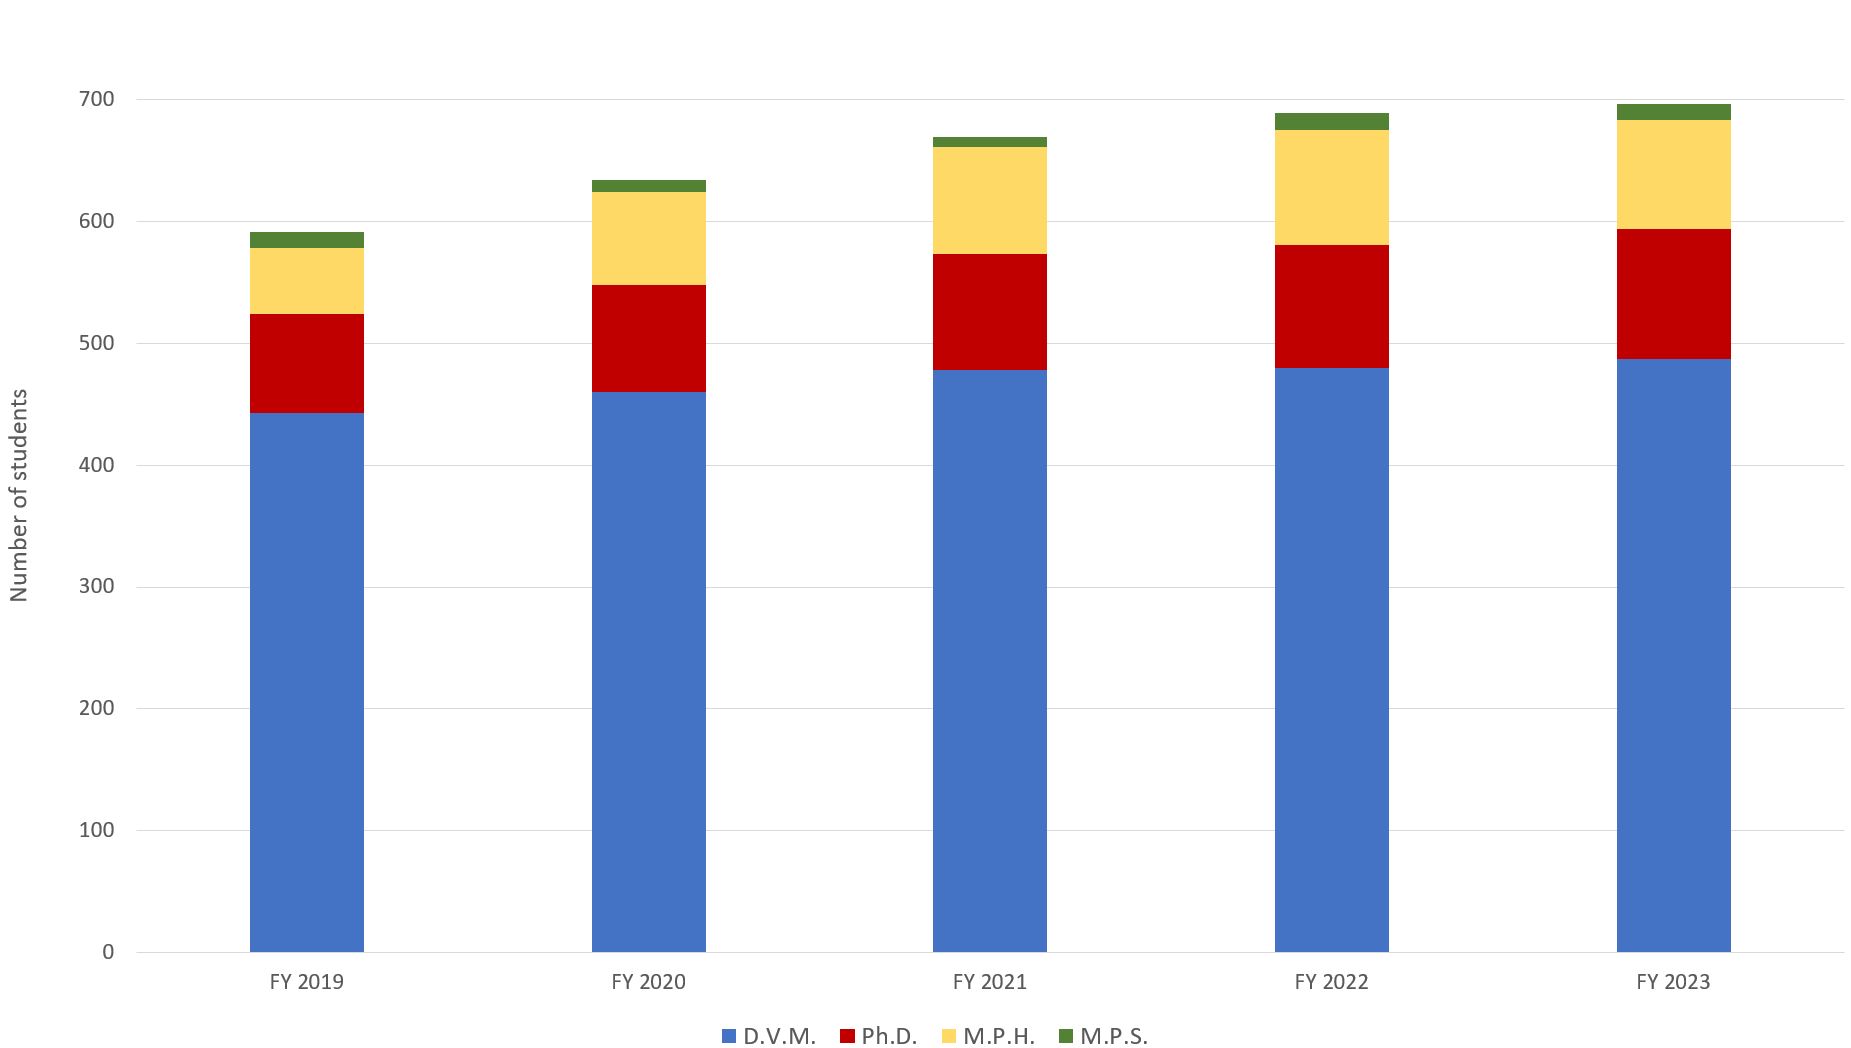
Total Students - All Degree Programs
| Total students, all degree programs table | |||||
|---|---|---|---|---|---|
| Year | FY 2019 | FY 2020 | FY 2021 | FY 2022 | FY 2023 |
| D.V.M. | 443 | 460 | 478 | 480 | 486 |
| Ph.D. | 81 | 88 | 95 | 101 | 107 |
| M.P.H. | 54 | 76 | 88 | 94 | 89 |
M.P.S. | 13 | 10 | 8 | 14 | 13 |
| Total | 591 | 63 | 669 | 689 | 696 |
- 50% NYS residents in D.V.M. program
- 57% Under-represented minority students in the M.P.H. program
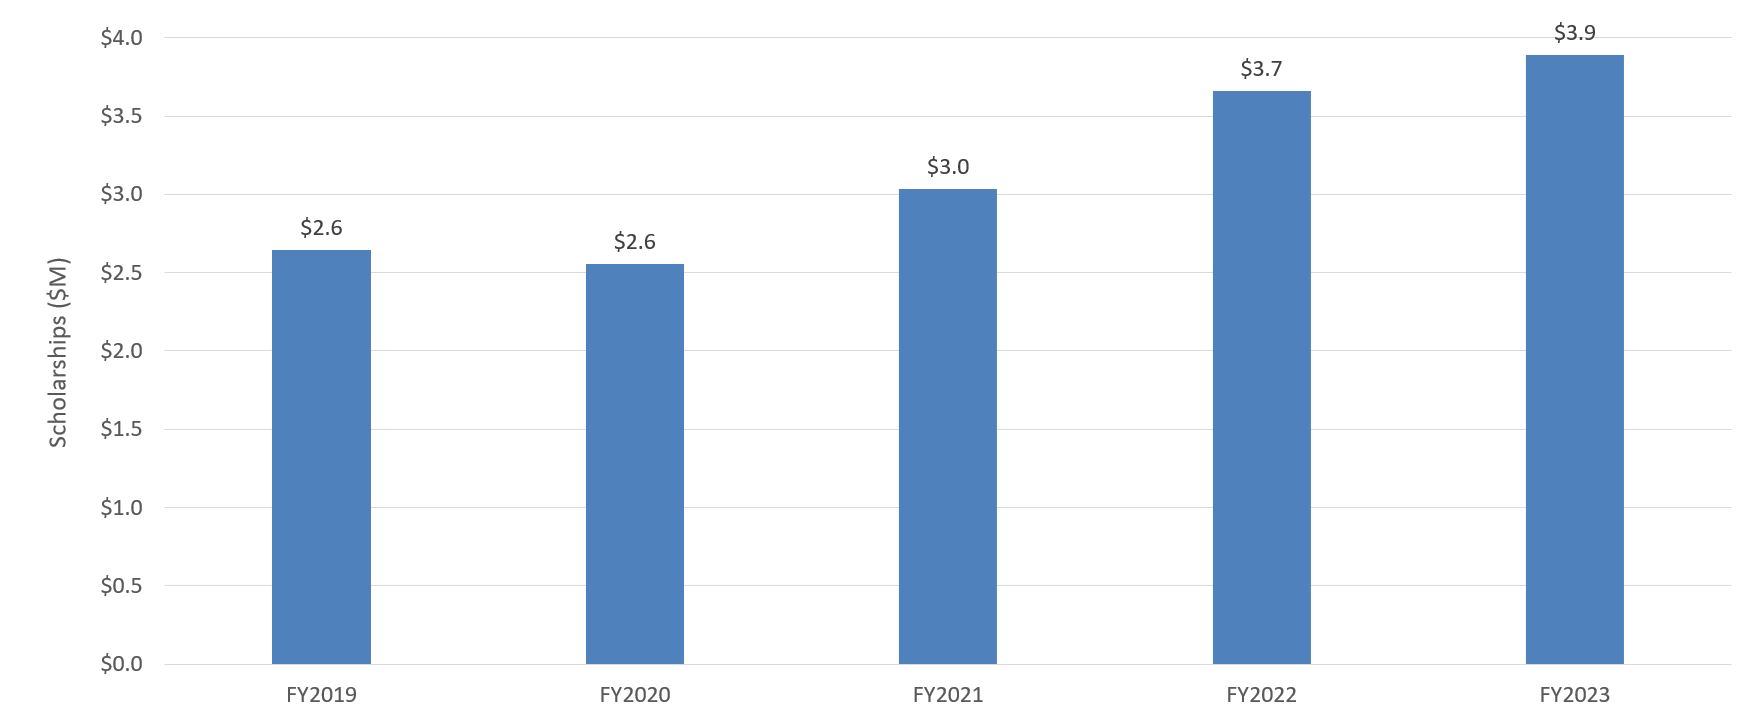
D.V.M. Program Scholarships ($M, all classes)
Research
This year saw our research programs broaden their impact across campus and among disciplines; the college hosted the inaugural Intercampus Vaccine Symposium and Cornell Center for Antimicrobial Resistance Research and Education Symposium, as well as the Tri-Institutional Symposium on Reproductive Biology and Infertility and Symposium on Engineering for Reproductive Medicine. Our researchers made meaningful discoveries, including that the omicron virus replicates early during infection, that gene enhancer-promoter interactions both drive, and are driven by, transcription, and a biomarker that is highly associated with early joint injury and could help with early diagnosis for arthritis. Our research priority areas continue to be infectious disease, genomics, cancer biology, reproductive biology, stem cell biology and regenerative medicine, dairy and sustainable food production, and applied clinical research. The college also led an effort to secure federal approval for select agent research with animal viruses, and is now approved for studies with African Swine Fever Virus, which opens new opportunities for grant support and work on other select agents.
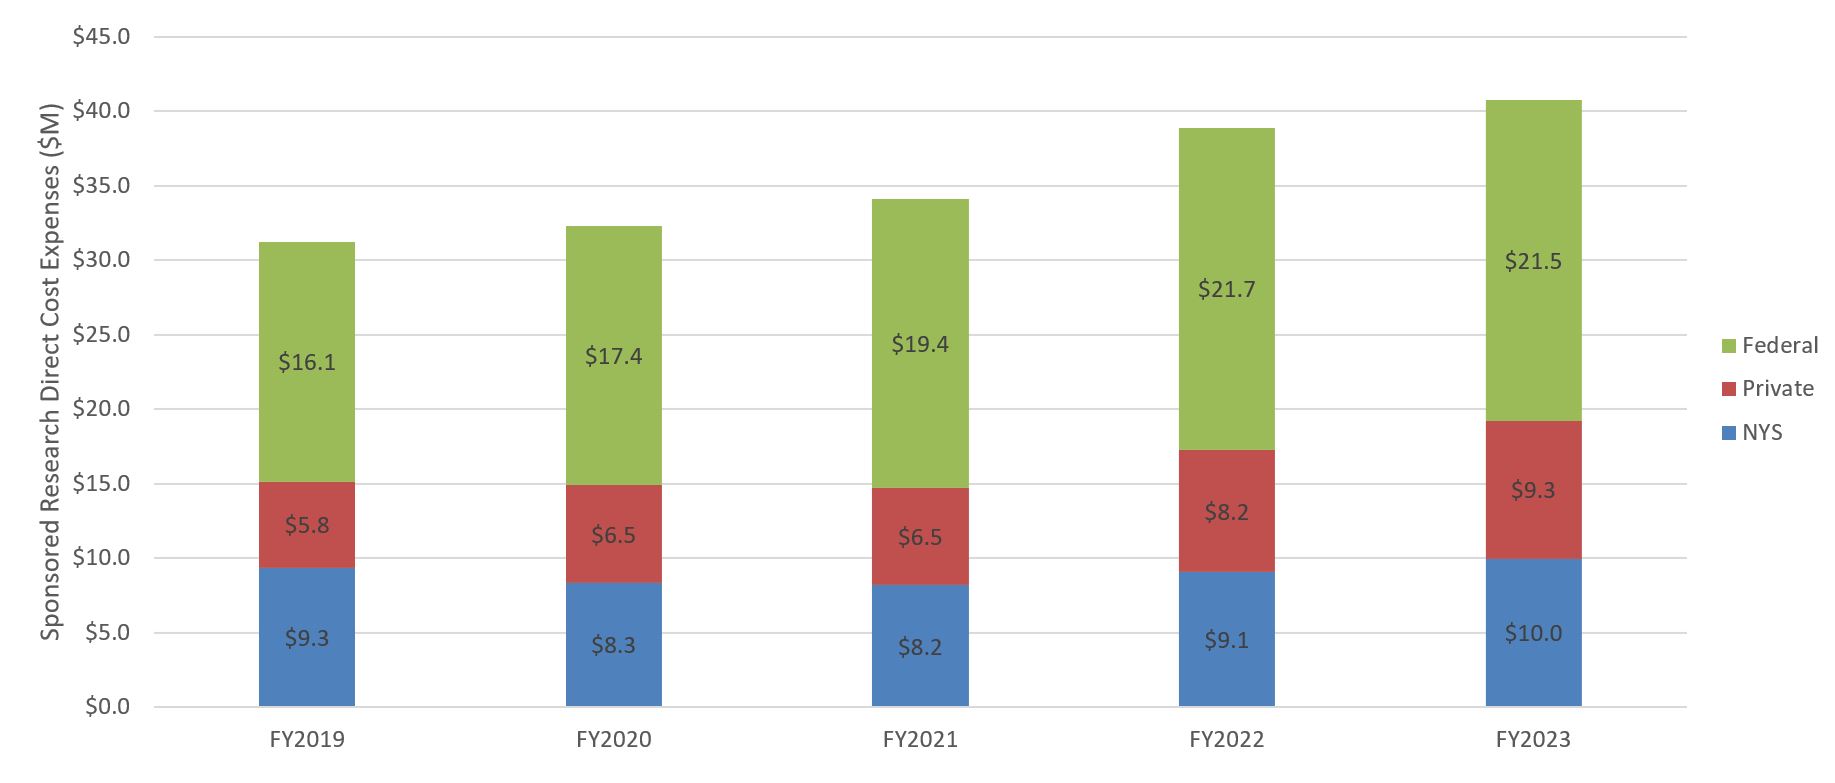
Sponsored research direct cost expenses ($M) FY 2019 to FY 2023
- CVM holds the most NIH R01 grants among U.S. veterinary colleges and ranks second in total NIH funding
- 53% success rate in internal grant proposals
- $2.25 million in internal grant research funding awarded
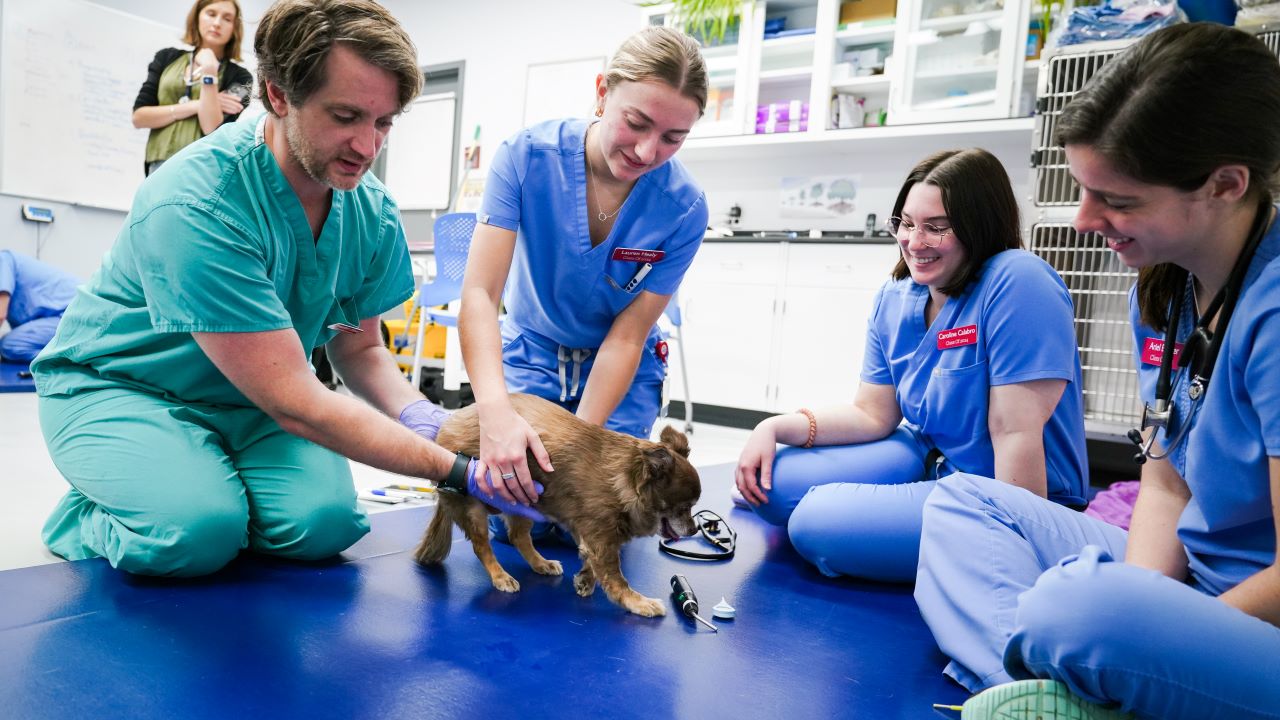
Clinical and Diagnostic Services
Hospitals
Hospital caseload and diagnostic lab accessions increased above pre-pandemic historical highs by 15%+. Hospital facility upgrades were made and new technology platforms implemented to improve workflow, service and support student learning and clinical research. Hospital priorities include adding urgent/fast track care doctors to improve community/regional accessibility, conducting a space study to enable continued caseload growth, client service excellence through training, career development and organization restructuring, and IT ecosystem continuous improvement.
Cornell University Hospital for Animals Caseload by month FY2019 to FY2023
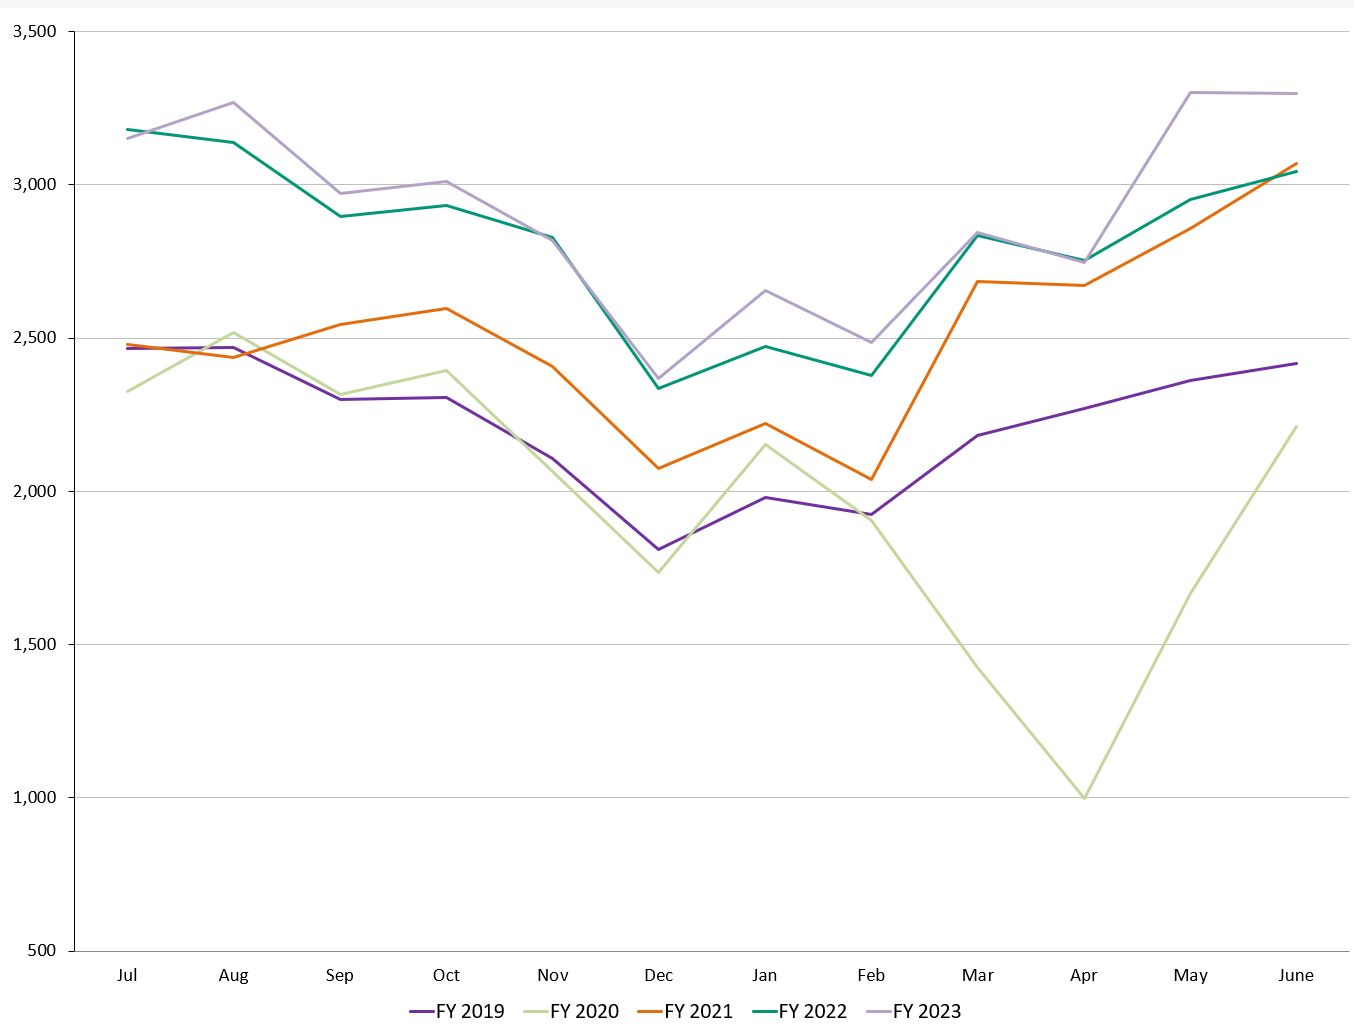
Cornell University Hospital for Animals Caseload by month FY2019 to FY2023 data table
| Time | Jul | Aug | Sep | Oct | Nov | Dec | Jan | Feb | Mar | Apr | May | June | YTD |
|---|---|---|---|---|---|---|---|---|---|---|---|---|---|
| FY 2019 | 2,466 | 2,471 | 2,300 | 2,306 | 2,107 | 1,809 | 1,979 | 1,924 | 2,183 | 2,271 | 2,362 | 2,417 | 26,594 |
| FY 2020 | 2,325 | 2,519 | 2,316 | 2,394 | 2,066 | 1,736 | 2,153 | 1,904 | 1,424 | 999 | 1,666 | 2,213 | 23,715 |
| FY 2021 | 2,479 | 2,437 | 2,545 | 2,597 | 2,408 | 2,074 | 2,222 | 2,038 | 2,684 | 2,671 | 2,858 | 3,070 | 30,083 |
| FY 2022 | 3,180 | 3,138 | 2,896 | 2,932 | 2,827 | 2,336 | 2,474 | 2,377 | 2,835 | 2,753 | 2,952 | 3,045 | 33,745 |
| FY 2023 | 3,151 | 3,270 | 2,972 | 3,010 | 2,819 | 2,369 | 2,657 | 2,486 | 2,845 | 2,747 | 3,301 | 3,297 | 34,924 |
Animal Health Diagnostic Center
The diagnostic lab led our response to the avian flu (HPAI), and developed whole genome sequencing for SARS-CoV-2 in wildlife and humans. New York State provided $8.75M in funding for capital programs. The AHDC is prioritizing leveraging technology (website, portal, new software) to manage increased workload. The growth in annual submission load has increased +76% since moving into the current central building in 2010, and therefore also requires additional space. To support this the diagnostic center is seeking $19.4 M from New York state to construct a building addition.
Accessions* (K) FY2019 to FY2023
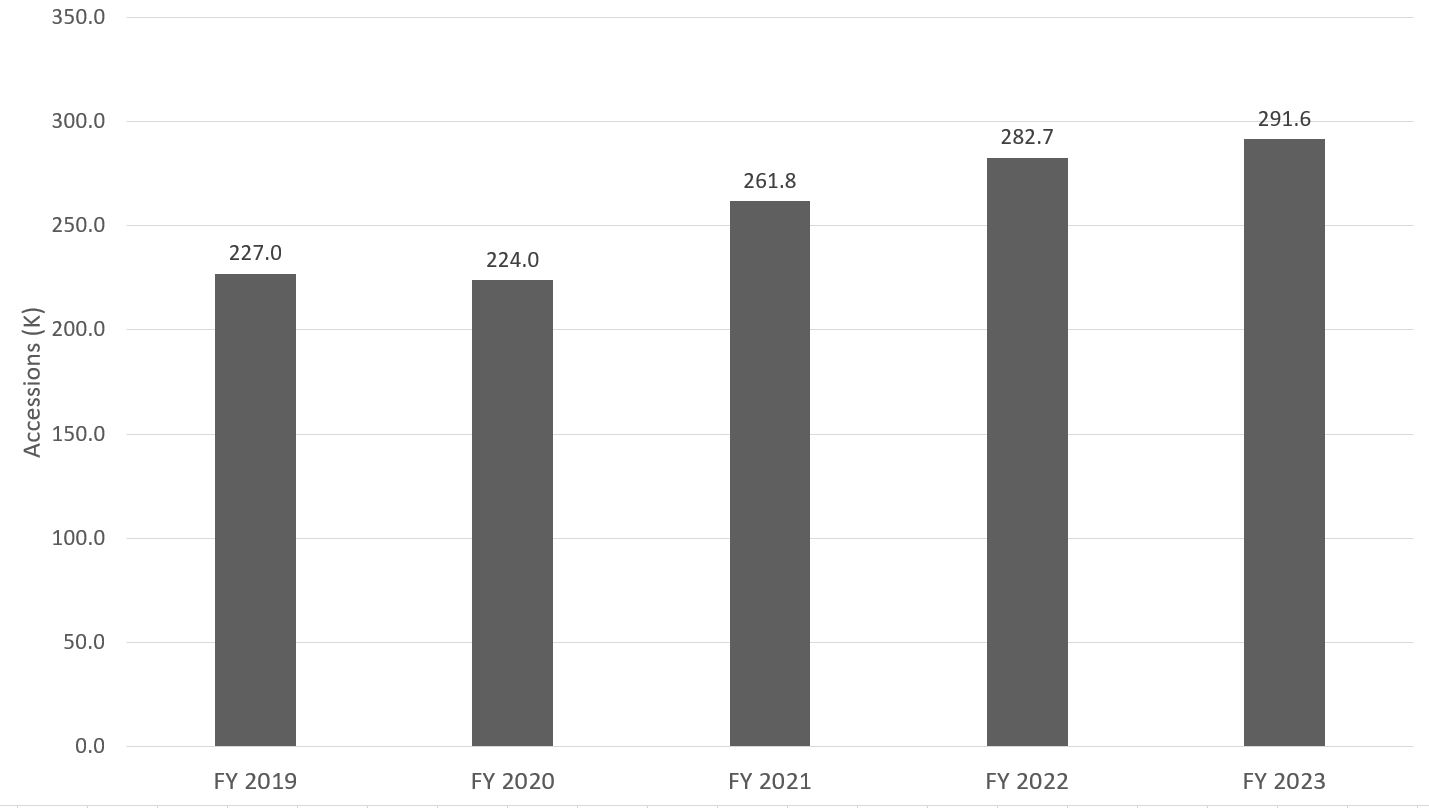
* Accessions refer to an ordered test or group of tests from a client, and can include one or multiple samples
Faculty & Staff
- CVM faculty numbers have grown by 15% over the past 5 years to a total of 246
- New faculty development program launched
- Number of tenure/tenure-track faculty: 121
- CVM staff have grown by 9% over the past 5 years to a total of 643
- CVM interns and residents grew by 24% over the past 5 years to a total of 102
- "Dr. Alexander de Lahunta Teaching Award" established
- Jessica McArt, D.V.M. ’07, Ph.D. ’13 named chair of the Department of Population Medicine and Diagnostic Sciences [Dr. Diego Diel serving as interim chair of the department through June 2024]
- Praveen Sethupathy ’03, Ph.D. named chair of the Department of Biomedical Sciences
Alumni Affairs and Development
- Roughly 200 graduates and their guests attended the 2023 Reunion
- $33.53 M in total new gifts and commitments
- $20.10 M raised in cash
- $1.19 M raised for Annual Fund
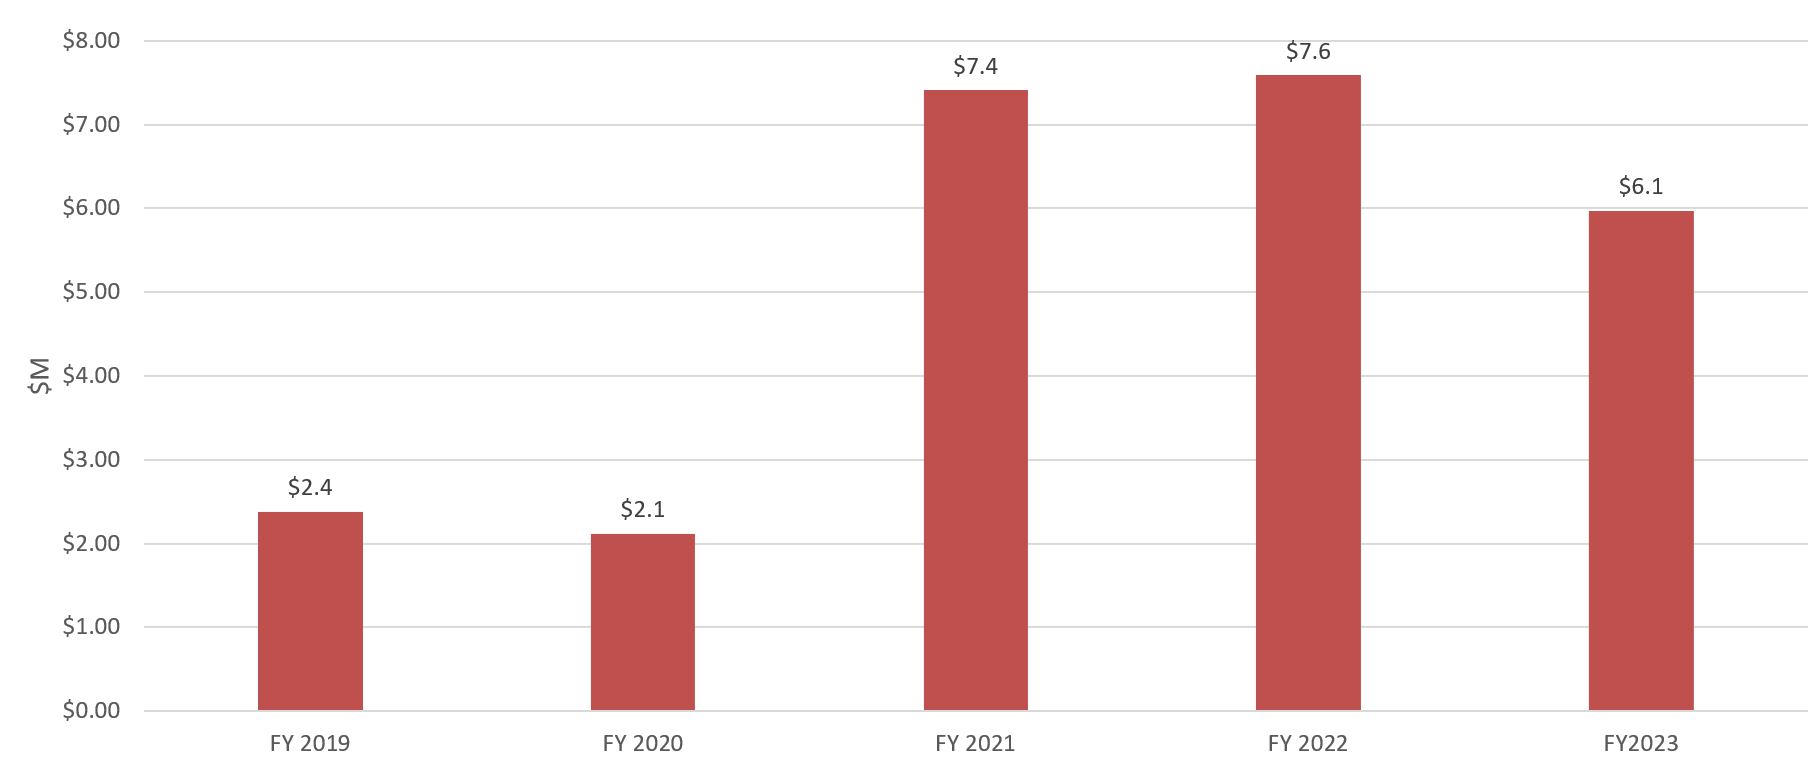
Scholarship Support: New Gifts and Commitments Raised FY2019 to FY2023
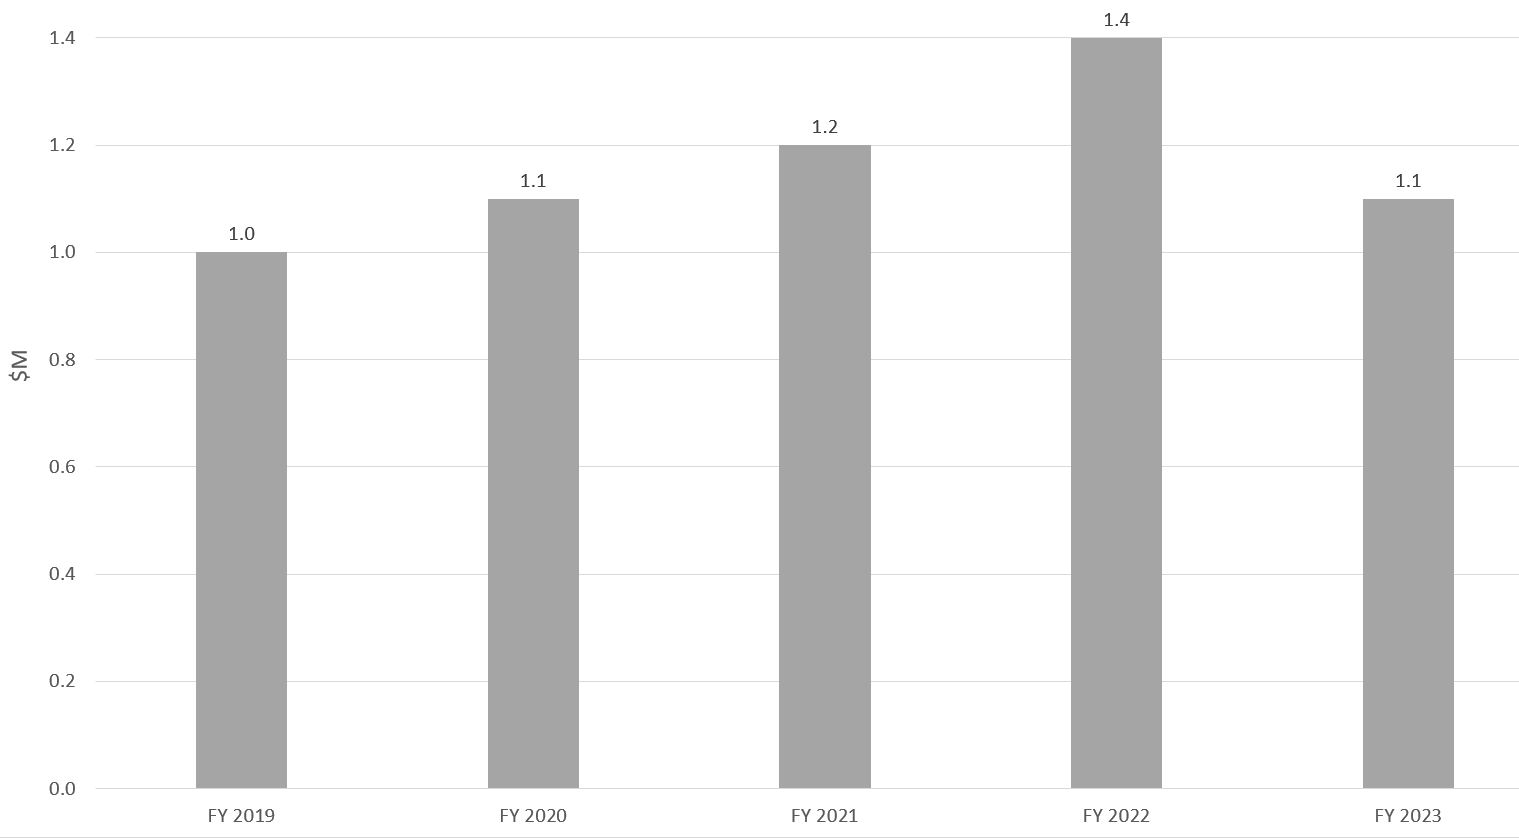
Annual Fund Results FY2019 to FY2023
The college consistently raises over $1M annually through donations to the Annual Fund. These funds provide support to areas in need such as the student experience, faculty recruitment, and patient care in our animal hospitals.
Financials
- Strong growth in revenues from CVM enterprise units
- Growth in the faculty numbers
- Successfully increased financial aid to students
- Growth in building and equipment projects
| Select Revenue Trend ($M) | FY 2019 | FY 2020 | FY 2021 | FY 2022 | FY 2023 |
|---|---|---|---|---|---|
| Tuition and Fees | 25.8 | 28.3 | 30.6 | 33.1 | 34.1 |
| Current Use Gifts | 8.1 | 9.8 | 9.1 | 15.5 | 13.6 |
| Investment Distributions | 10.6 | 11.1 | 11.6 | 11.1 | 13.6 |
| State Appropriations | 34.8 | 34.8 | 32.5 | 34.5 | 34.5 |
| AHDC Sales & Services | 18.3 | 19.5 | 21.6 | 23.6 | 25.0 |
| CUHA Sales & Services | 21.5 | 22.4 | 25.6 | 29.2 | 31.2 |
| Indirect Cost Recoveries | 9.2 | 9.2 | 10.3 | 11.7 | 12.8 |
| Sponsored Contracts & Grants | 32.5 | 27.7 | 32.4 | 36.5 | 41.9 |
Select Expense Trend ($M) | FY 2019 | FY 2020 | FY 2021 | FY 2022 | FY 2023 |
|---|---|---|---|---|---|
| Salaries & Wages, Faculty | 37.0 | 37.9 | 38.70 | 42.0 | 47.2 |
| Salaries & Wages, Staff | 44.0 | 46.6 | 49.8 | 51.5 | 56.3 |
| Capital Acquisitions | 2.8 | 3.3 | 3.4 | 3.9 | 5.7 |
| Financial Aid | 5.8 | 6.5 | 7.4 | 8.3 | 8.6 |
| Utilities | 6.2 | 5.4 | 5.5 | 5.8 | 5.7 |
| University Administrative Costs | 30.6 | 31.78 | 33.1 | 33.8 | 37.1 |