


BBS PhD Alumni Career Outcomes: 2008 - 2025
Distribution of current employment sectors among PhD graduates from 2008 onward (updated October 2025; n = 288)
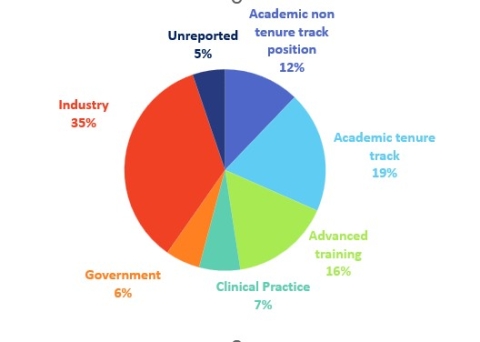
- Industry: 35%
- Advanced training: 16%
- Academic tenure-track: 19%
- Academic non-tenure track: 12%
- Unreported: 5%
- Government: 6%
- Clinical practice: 7%