


Reference Intervals
The reference intervals provided by our laboratory were established in our laboratory from healthy animals, using our own equipment with specific methods and reagents. Because results are analyzer-, method- and reagent- dependent, these intervals are only valid for results from our laboratory. We have reference intervals for hematology and chemistry for dogs, cats, horses, cattle, goats and alpacas. We have blood gas and electrolyte ranges for dogs, cats, horses and cattle only. For species without established reference intervals, you should refer to general publications and textbooks as a guideline only. With many of our tests, (eg, immunology) we use the manufactures' intervals, or do not provide intervals, however, we usually provide guidelines for interpretation.
We establish reference intervals by collecting blood from at least 50 adult healthy animals. These healthy animals are obtained from a variety of sources (eg, student- or faculty-owned). Therefore, our reference intervals are only applicable for adult animals and not young animals. Results from young animals may fall outside our reference intervals because of age-dependent changes in their analytes. For example, phosphate concentrations and alkaline phosphatase activity are higher in young animals and decrease to within reference intervals at about one year of age. Foals and calves have microcytic erythrocytes until one year of age. Hematocrits are lower and lymphocyte counts are higher in puppies and kittens under four months of age. Similarly, immunoglobin concentrations are lower in animals under one year of age.
We establish reference intervals using one of 2 techniques, based on the distribution of the data:
-
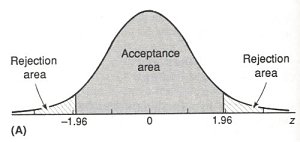
Normal distribution (gaussian):
When data is normally distributed (a bell curve as illustrated below), the mean ± 2 standard deviations is used to establish the reference intervals. With this approach, confidence intervals on the upper and lower limit of the reference interval can be provided. -
Non-normal distribution (non-gaussian):
If the data is significantly skewed, percentiles are used to establish reference intervals. The 2.5 and 97.5 percentiles are the upper and lower limits of the reference intervals and incorporate the middle 95% of the data. Since most of the variables that we test for are not normally distributed, most of our reference intervals are based on 95% percentiles.
With either technique, the resulting interval then will include 95% of normal samples. As a result, up to 5% of normal animals may have values that fall slightly outside (above or below) the reference intervals for a given test. When numerous tests are run on the same animal, the chances of obtaining one or more slightly "abnormal" results on an animal that actually is normal rises (p = 1 - 0.95n). For 12 tests, p = 0.46; for 21 tests, p = 0.66.